Skip to content
ImagesFree

Creating A Creative Food Infographic Sheet 📋 Use Gemini Nano Banana Pro 2.0 🍌 @NanoBanana @GeminiApp 💡Simply Change [Dish Name] Pr

Creating A Creative Food Infographic Sheet 📋 Use Gemini Nano Banana Pro 2.0 🍌 @NanoBanana @GeminiApp 💡Simply Change [Dish Name] Pr

Gemini

Source previews

These example images come from the original source. DROPIDEA has not independently tested these examples; results depend on the model and settings.

Ready to personalize

Your prompt

Source text

Replace the red variables with your information. Copy the full prompt and use it with your preferred agent.

TXT MD English version
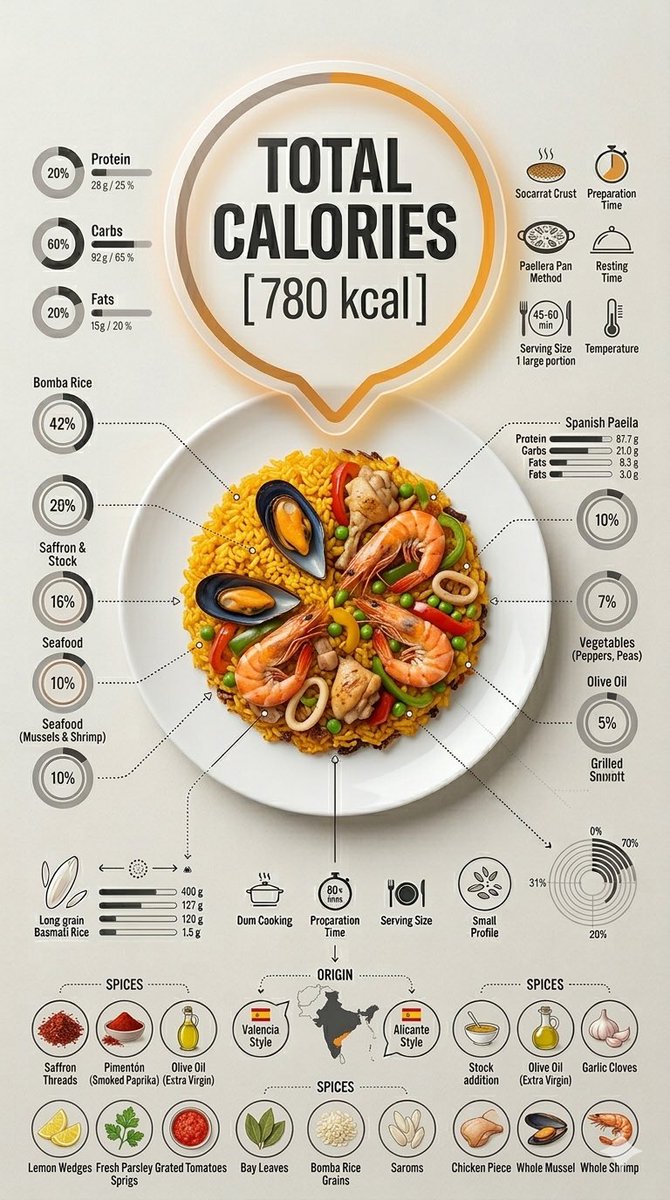
Creating A Creative Food Infographic Sheet 📋 Use Gemini Nano Banana Pro 2.0 🍌 @NanoBanana @GeminiApp 💡Simply Change [Dish Name] Prompt ⤵️ Ultra-clean top-down (90° flat lay) infographic composition. A perfectly centered white ceramic plate sits on a seamless light background. On the plate: [Dish Name] shown in a precise cross-section or layered cutaway, revealing internal ingredients, textures, and structure with extreme clarity. PRIMARY FOCAL POINT (HERO ELEMENT): Above the plate, occupying a large portion of the upper canvas, place an oversized floating infographic bubble displaying: TOTAL CALORIES [XXXX kcal] The calorie bubble is significantly larger than any other element, instantly readable at thumbnail size. Design it with strong visual contrast: bold sans-serif typography, thick outline or semi-transparent glassmorphism, subtle glow or drop shadow, and clean UI styling. This is the first thing the eye sees. SECONDARY ELEMENTS: Surrounding the plate, fill the remaining space with a dense, high-information infographic system: – Nutritional breakdown charts (protein, carbs, fats) – Ingredient percentage bars and rings – Cooking or preparation temperatures and times – Origin, aging, or production icons – Measurement scales, micro-diagrams, data badges Use thin vector connectors, dotted lines, arrows, pictograms, and radial charts clearly linking data to specific food components. Visual hierarchy rules: Calorie bubble = dominant Plate + food = secondary anchor Surrounding data = tertiary but dense and readable Design language: premium editorial infographic, Apple UI × National Geographic food science, extremely clean, structured, and modern. Color palette: natural food colors, monochrome infographic UI, one accent color reserved exclusively for the calorie bubble. Lighting: soft studio lighting, zero clutter, flat background for maximum contrast. Output: 9:16 Vertical portrait, 8K, highly detailed, 1080×192, ultra-crisp, social-feed optimized, no watermark.
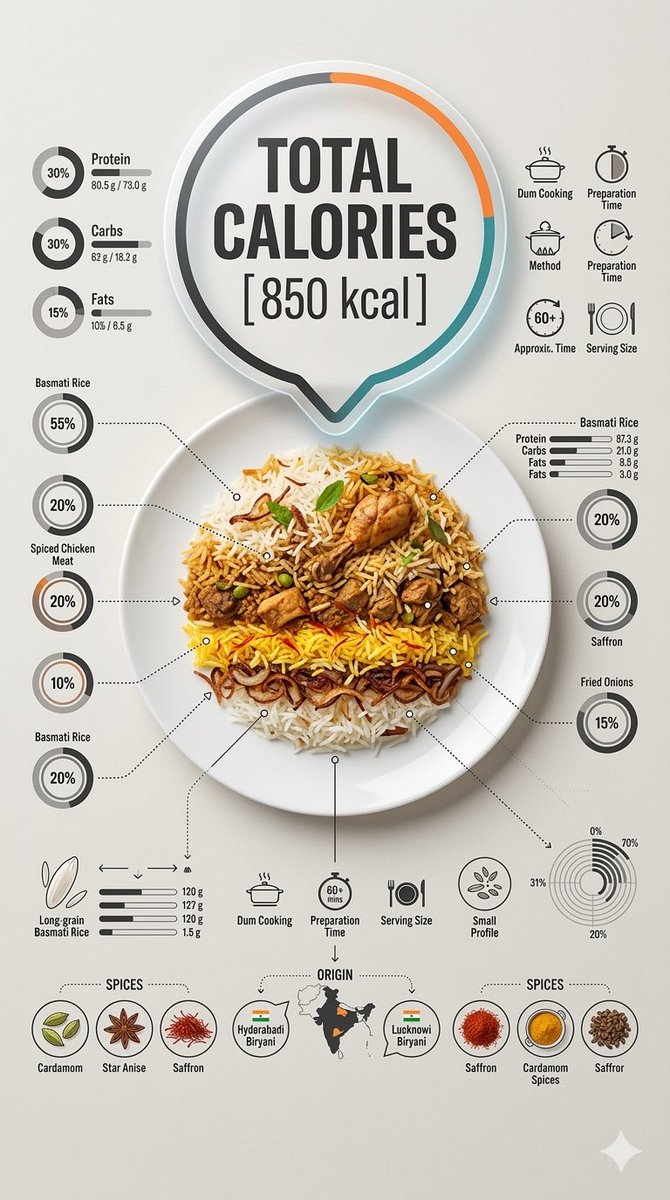
Preview results

Your prompt

Creating A Creative Food Infographic Sheet 📋 Use Gemini Nano Banana Pro 2.0 🍌 @NanoBanana @GeminiApp 💡Simply Change [Dish Name] Prompt ⤵️ Ultra-clean top-down (90° flat lay) infographic composition. A perfectly centered white ceramic plate sits on a seamless light background. On the plate: [Dish Name] shown in a precise cross-section or layered cutaway, revealing internal ingredients, textures, and structure with extreme clarity. PRIMARY FOCAL POINT (HERO ELEMENT): Above the plate, occupying a large portion of the upper canvas, place an oversized floating infographic bubble displaying: TOTAL CALORIES [XXXX kcal] The calorie bubble is significantly larger than any other element, instantly readable at thumbnail size. Design it with strong visual contrast: bold sans-serif typography, thick outline or semi-transparent glassmorphism, subtle glow or drop shadow, and clean UI styling. This is the first thing the eye sees. SECONDARY ELEMENTS: Surrounding the plate, fill the remaining space with a dense, high-information infographic system: – Nutritional breakdown charts (protein, carbs, fats) – Ingredient percentage bars and rings – Cooking or preparation temperatures and times – Origin, aging, or production icons – Measurement scales, micro-diagrams, data badges Use thin vector connectors, dotted lines, arrows, pictograms, and radial charts clearly linking data to specific food components. Visual hierarchy rules: Calorie bubble = dominant Plate + food = secondary anchor Surrounding data = tertiary but dense and readable Design language: premium editorial infographic, Apple UI × National Geographic food science, extremely clean, structured, and modern. Color palette: natural food colors, monochrome infographic UI, one accent color reserved exclusively for the calorie bubble. Lighting: soft studio lighting, zero clutter, flat background for maximum contrast. Output: 9:16 Vertical portrait, 8K, highly detailed, 1080×192, ultra-crisp, social-feed optimized, no watermark.

Related prompts