انتقل إلى المحتوى
صورمجاني

Creating A Creative Food Infographic Sheet 📋 Use Gemini Nano Banana Pro 2.0 🍌 @NanoBanana @GeminiApp 💡Simply Change [Dish Name] Pr

Creating A Creative Food Infographic Sheet 📋 Use Gemini Nano Banana Pro 2.0 🍌 @NanoBanana @GeminiApp 💡Simply Change [Dish Name] Pr

جيميناي

معاينات من المصدر

صور النتائج منشورة لدى المصدر الأصلي. لم تُختبر هذه الأمثلة داخل دروب إيديا؛ قد تختلف النتائج بحسب النموذج والإعدادات.
جاهز للتخصيص والاستخدام

البرومبت الخاص بك

نص المصدر

هذا البرومبت بانتظار إكمال تعريبه وتدقيقه. تظهر النسخة العربية بعد اعتمادها، مع حفظ الأصل والنسخة الإنجليزية.

استبدل المتغيرات المميزة بالأحمر ببياناتك. انسخ النص كاملًا ثم استخدمه مع الوكيل الذي تفضله.

TXT MD النسخة الإنجليزية
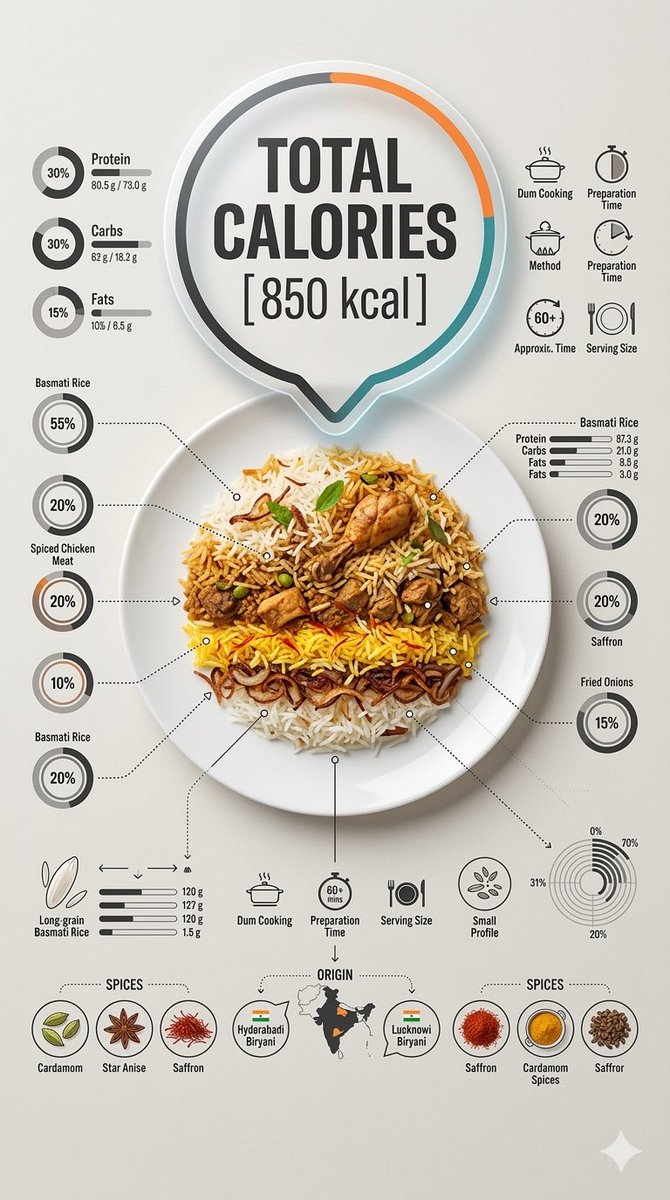
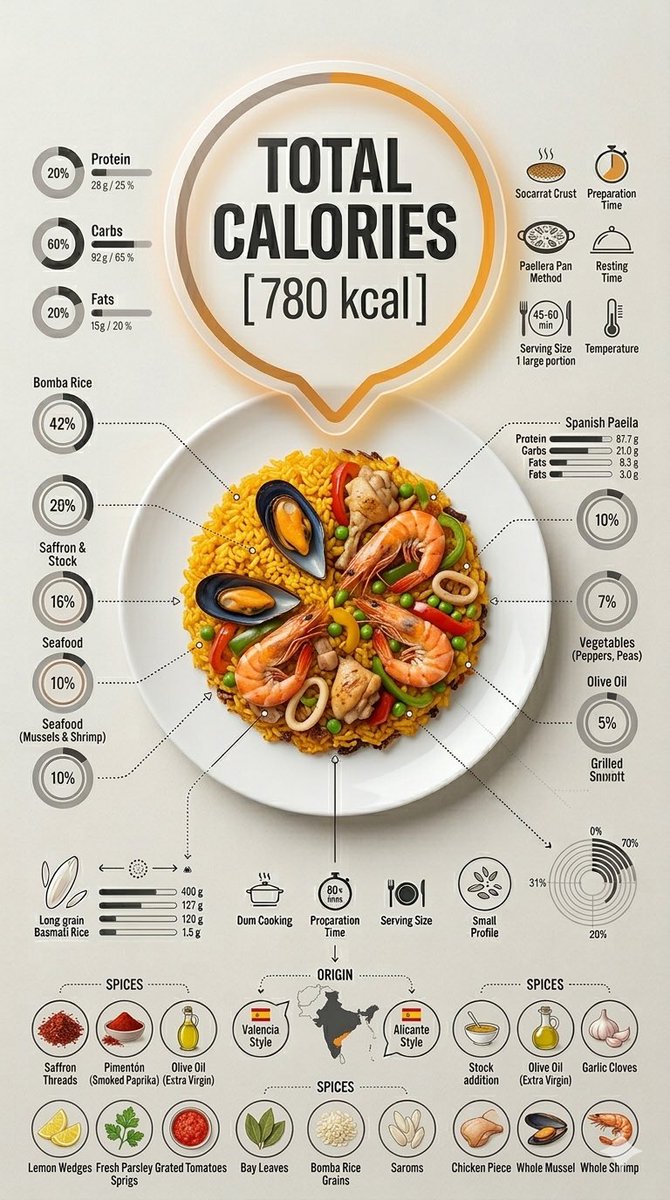
Prompt 78 Creating A Creative Food Infographic Sheet 📋 Use Gemini Nano Banana Pro 2.0 🍌 @NanoBanana @GeminiApp 💡Simply Change [Dish Name] Prompt ⤵️ Ultra-clean top-down (90° flat lay) infographic composition. A perfectly centered white ceramic plate sits on a seamless light background. On the plate: [Dish Name] shown in a precise cross-section or layered cutaway, revealing internal ingredients, textures, and structure with extreme clarity. PRIMARY FOCAL POINT (HERO ELEMENT): Above the plate, occupying a large portion of the upper canvas, place an oversized floating infographic bubble displaying: TOTAL CALORIES [XXXX kcal] The calorie bubble is significantly larger than any other element, instantly readable at thumbnail size. Design it with strong visual contrast: bold sans-serif typography, thick outline or semi-transparent glassmorphism, subtle glow or drop shadow, and clean UI styling. This is the first thing the eye sees. SECONDARY ELEMENTS: Surrounding the plate, fill the remaining space with a dense, high-information infographic system: – Nutritional breakdown charts (protein, carbs, fats) – Ingredient percentage bars and rings – Cooking or preparation temperatures and times – Origin, aging, or production icons – Measurement scales, micro-diagrams, data badges Use thin vector connectors, dotted lines, arrows, pictograms, and radial charts clearly linking data to specific food components. Visual hierarchy rules: Calorie bubble = dominant Plate + food = secondary anchor Surrounding data = tertiary but dense and readable Design language: premium editorial infographic, Apple UI × National Geographic food science, extremely clean, structured, and modern. Color palette: natural food colors, monochrome infographic UI, one accent color reserved exclusively for the calorie bubble. Lighting: soft studio lighting, zero clutter, flat background for maximum contrast. Output: 9:16 Vertical portrait, 8K, highly detailed, 1080×192, ultra-crisp, social-feed optimized, no watermark.
معاينة النتائج

البرومبت الخاص بك

Prompt 78 Creating A Creative Food Infographic Sheet 📋 Use Gemini Nano Banana Pro 2.0 🍌 @NanoBanana @GeminiApp 💡Simply Change [Dish Name] Prompt ⤵️ Ultra-clean top-down (90° flat lay) infographic composition. A perfectly centered white ceramic plate sits on a seamless light background. On the plate: [Dish Name] shown in a precise cross-section or layered cutaway, revealing internal ingredients, textures, and structure with extreme clarity. PRIMARY FOCAL POINT (HERO ELEMENT): Above the plate, occupying a large portion of the upper canvas, place an oversized floating infographic bubble displaying: TOTAL CALORIES [XXXX kcal] The calorie bubble is significantly larger than any other element, instantly readable at thumbnail size. Design it with strong visual contrast: bold sans-serif typography, thick outline or semi-transparent glassmorphism, subtle glow or drop shadow, and clean UI styling. This is the first thing the eye sees. SECONDARY ELEMENTS: Surrounding the plate, fill the remaining space with a dense, high-information infographic system: – Nutritional breakdown charts (protein, carbs, fats) – Ingredient percentage bars and rings – Cooking or preparation temperatures and times – Origin, aging, or production icons – Measurement scales, micro-diagrams, data badges Use thin vector connectors, dotted lines, arrows, pictograms, and radial charts clearly linking data to specific food components. Visual hierarchy rules: Calorie bubble = dominant Plate + food = secondary anchor Surrounding data = tertiary but dense and readable Design language: premium editorial infographic, Apple UI × National Geographic food science, extremely clean, structured, and modern. Color palette: natural food colors, monochrome infographic UI, one accent color reserved exclusively for the calorie bubble. Lighting: soft studio lighting, zero clutter, flat background for maximum contrast. Output: 9:16 Vertical portrait, 8K, highly detailed, 1080×192, ultra-crisp, social-feed optimized, no watermark.

برومبتات ذات صلة

صورمعاينة المصدر

ملصق طعام تحريري مع دفتر رسم المكونات

ملصق رأسي فاخر بنسبة 3:4 يجمع تصويرًا فوتوغرافيًا واقعيًا لطبق محلي واحد في الأعلى مع ورقة رسم يدوية لرصد مكوناته ف...

أوبن إيه آي
مجاني
معاينة النتائج

ملصق طعام تحريري مع دفتر رسم المكونات

ملصق طعام تحريري مع دفتر رسم المكونات
صورمعاينة المصدر

مقارنة توليد الصور عبر نماذج الذكاء الاصطناعي: ليمونة مقطوعة طوليًا

منشور مقارنة وتقييم لاختبار قدرة نماذج الذكاء الاصطناعي التوليدية المختلفة على فهم البنية الداخلية والتشريح البصري...

أوبن إيه آي
مجاني
معاينة النتائج

مقارنة توليد الصور عبر نماذج الذكاء الاصطناعي: ليمونة مقطوعة طوليًا

مقارنة توليد الصور عبر نماذج الذكاء الاصطناعي: ليمونة مقطوعة طوليًا
صورمعاينة المصدر

تصوير إعلاني تجاري متميز للأطعمة مع مكونات معلقة

نمط موجه لتوليد لقطات إعلانية احترافية للأطعمة والمشروبات، تتضمن طبقاً رئيسياً مع مكونات متناثرة في الهواء ورذاذ سا...

توليد الصور
مجاني
معاينة النتائج

تصوير إعلاني تجاري متميز للأطعمة مع مكونات معلقة

تصوير إعلاني تجاري متميز للأطعمة مع مكونات معلقة